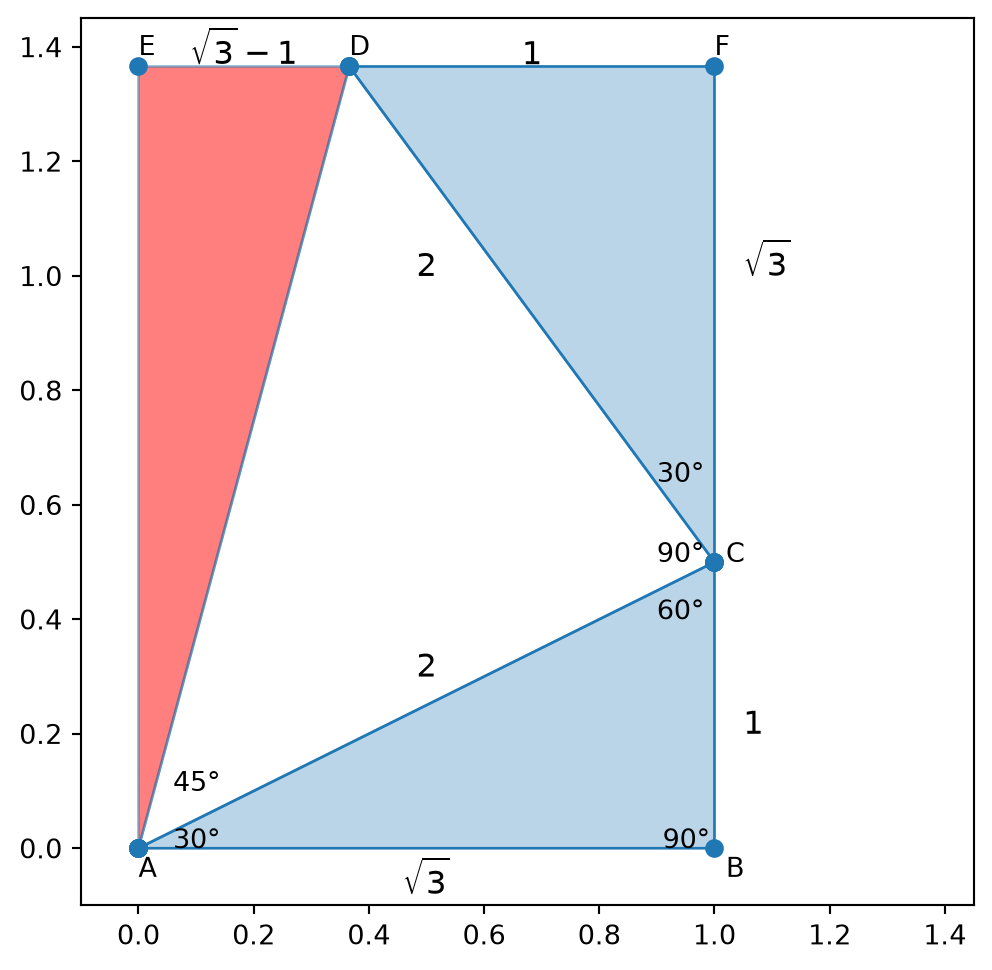
import shapely.plotting
import matplotlib.pyplot as plt
from shapely.geometry import Polygon
import numpy as np

A = (0, 0)
B = (1, 0)
C = (1, np.sin(np.radians(30)))
D = (np.sqrt(2) * np.cos(np.radians(75)), np.sqrt(2) * np.sin(np.radians(75)))
E = (0, np.sqrt(2) * np.sin(np.radians(75)))
F = (1, np.sqrt(2) * np.sin(np.radians(75)))

polygon1 = Polygon([A, B, C])
polygon2 = Polygon([A, C, D])
polygon3 = Polygon([A, E, D])
polygon4 = Polygon([C, D, F])

fig, ax = plt.subplots(figsize=(6, 6))

shapely.plotting.plot_polygon(polygon1, ax=ax)
shapely.plotting.plot_polygon(polygon2, alpha=0.5, facecolor='none', ax=ax)
shapely.plotting.plot_polygon(polygon3, alpha=0.5, facecolor='red', ax=ax)
shapely.plotting.plot_polygon(polygon4, ax=ax)

# 軸の範囲を設定
plt.xlim(-0.1, 1.45)
plt.ylim(-0.1, 1.45)

# add label
plt.text(A[0], A[1] - 0.05, 'A')
plt.text(B[0]+0.02, B[1] - 0.05, 'B')
plt.text(C[0]+0.02, C[1], 'C')
plt.text(D[0], D[1] + 0.02, 'D')
plt.text(E[0], E[1] + 0.02, 'E')
plt.text(F[0], F[1] + 0.02, 'F')

# Add Angles
ax.text(A[0] + 0.06, A[1], f"{30}°", fontsize=10)
ax.text(A[0] + 0.06, A[1] + 0.1, f"{45}°", fontsize=10)
ax.text(B[0] - 0.09, B[1], f"{90}°", fontsize=10)
ax.text(C[0] - 0.1, C[1], f"{90}°", fontsize=10)
ax.text(C[0] - 0.1, C[1] + 0.14, f"{30}°", fontsize=10)
ax.text(C[0] - 0.1, C[1] - 0.1, f"{60}°", fontsize=10)

# Add length
ax.text(0.5, -0.08, "$\sqrt{3}$", fontsize=12, color="black", horizontalalignment="center")
ax.text(0.5, 0.3, "2", fontsize=12, color="black", horizontalalignment="center")
ax.text(0.5, 1.0, "2", fontsize=12, color="black", horizontalalignment="center")
ax.text(1.05, 0.2, "1", fontsize=12, color="black", horizontalalignment="left")
ax.text(1.05, 1.0, "$\sqrt{3}$", fontsize=12, color="black", horizontalalignment="left")
ax.text((D[0] + F[0])/2, 1.37,  "1", fontsize=12, color="black", horizontalalignment="center")
ax.text((D[0] + E[0])/2, 1.37,  "$\sqrt{3} - 1$", fontsize=12, color="black", horizontalalignment="center")


plt.show()