import plotly.graph_objects as go
fig = go.Figure()
# Add bars for 2024/2025
fig.add_trace(
go.Bar(
y=df.index,
x=df["2024"],
legendgroup="group",
legendgrouptitle_text="year",
name="2024",
orientation="h",
marker_color="#003366",
)
)
# Add bars for 2019
fig.add_trace(
go.Bar(
y=df.index,
x=df["2019"],
legendgroup="group",
legendgrouptitle_text="year",
name="2019",
orientation="h",
marker_color="#99ccff",
)
)
# Layout customization
fig.update_layout(
title=dict(
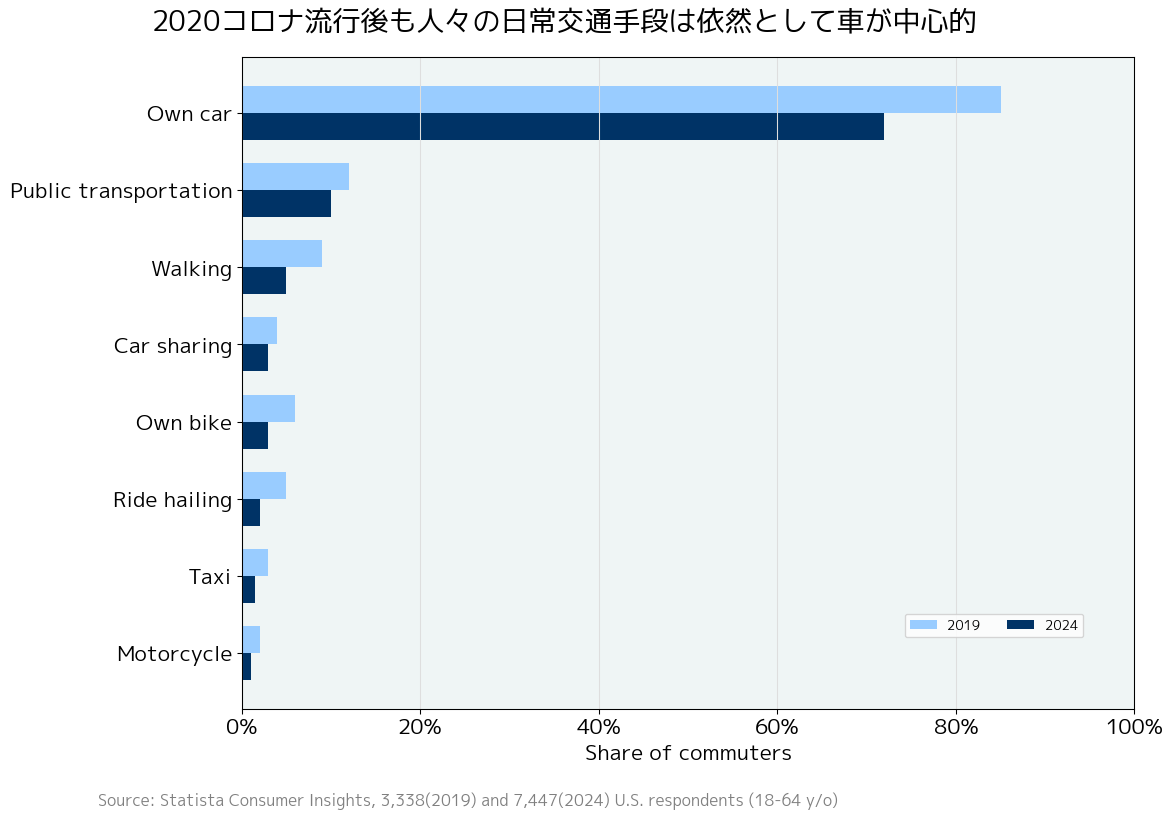
text="2020年コロナ流行後も人々の日常交通手段は依然として車が中心的",
font=dict(size=21),
),
xaxis=dict(
title="Share of commuters",
tickformat=".0%", # Format as percentage
tickfont=dict(size=16),
range=[0, 1.0],
gridcolor="#DEDEDE",
),
yaxis=dict(
tickfont=dict(size=16),
automargin=True, # helps avoid label clipping
),
barmode="group", # you can also try 'group' for grouped layout
height=600,
bargroupgap=0,
legend=dict(orientation="h", yanchor="bottom", y=0.1, xanchor="right", x=0.95),
plot_bgcolor="#EFF5F5",
)
fig.add_annotation(
text="Source: Statista Consumer Insights, 3,338(2019) and 7,447(2024) U.S. respondents (18-64 y/o)",
xref="paper",
yref="paper",
x=-0.15,
y=-0.2, # y < 0 puts it below the chart
showarrow=False,
font=dict(size=14, color="gray"),
xanchor="left",
)
fig.update_layout(
margin=dict(t=40, b=100) # increase bottom margin
)
fig.show()